About (v1.0)
Overview - PROVEAN (Protein Variation Effect Analyzer) v1.0
1. PROVEAN Score
PROVEAN was developed to predict whether a protein sequence variation affects protein function.
PROVEAN is able to provide predictions for any type of protein sequence variations including the following.
- Single or multiple amino acid substitutions
- Single or multiple amino acid insertions
- Single or multiple amino acid deletions
(a) Overview
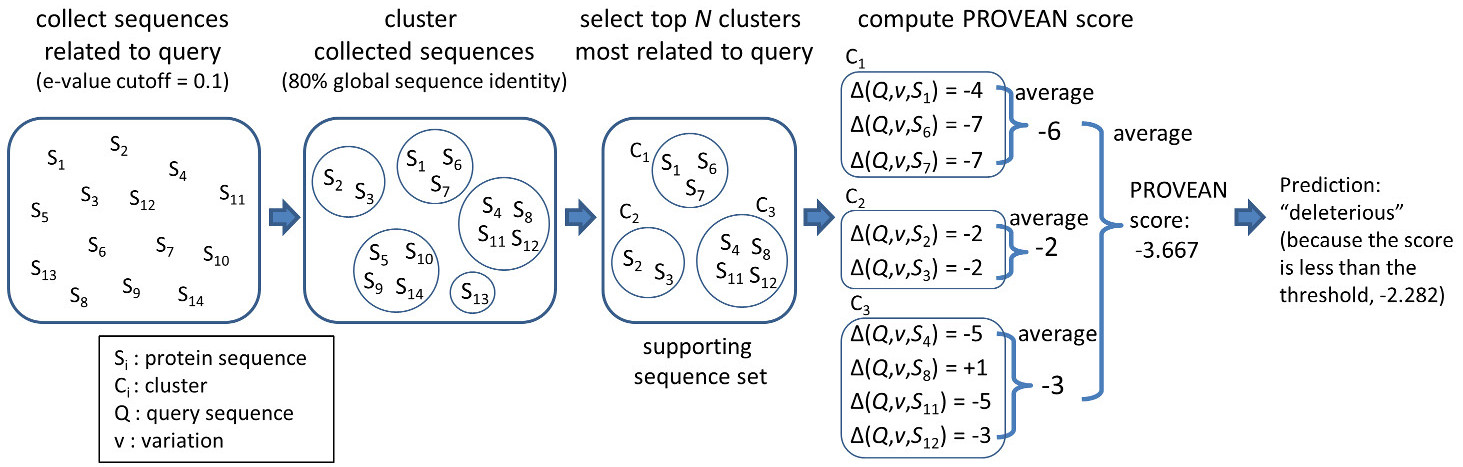
An overview of the PROVEAN procedure is shown in Figure 1. Briefly, clustering of BLAST hits is performed by CD-HIT. The top 45 clusters of closely related sequences form the supporting sequence set. A delta alignment score is computed for each supporting sequence. The scores are then averaged within and across clusters to generate the final PROVEAN score. If the PROVEAN score is equal to or below a predefined threshold (e.g. -2.28, details below), the protein variant is predicted to have a "deleterious/damaging" effect. If the PROVEAN score is above the threshold, the variant is predicted to have a "neutral/tolerated" effect.
Figure 1. Computing the PROVEAN score.
(b) Setting the PROVEAN score threshold
PROVEAN introduces a delta alignment score based on the reference and variant versions of a protein query sequence with respect to sequence homologs collected from the NCBI NR protein database through BLAST. The PROVEAN score distribution of a set of 58k Uniprot human protein variants with known functional outcome is shown in Figure 2. For maximum separation of the deleterious and neutral variants for all 4 classes of human protein variants ,the default score threshold is currently set at -2.28. To increase sensitivity of detection (at the expense of a decrease of specificity), a higher score threshold can also be used (e.g. -1.5).
Figure 2. PROVEAN score distribution for 58k deleterious and neutral Uniprot human protein variations.
2. PROVEAN Performance
The overall accuracy for binary classification of protein variants (deleterious or neutral):
- 79% for Uniprot human protein variations (download)
- 77% for Uniprot non-human protein variations (other mammals, plants, bacteria, etc.) (download)
Table 1. Number of human protein variations and prediction accuracy of PROVEAN.
| Variant types | Functional outcome | Peformance(%) | |||||
|---|---|---|---|---|---|---|---|
| Deleterious | Neutral | Total | Sensitivity | Specificity | Accuracy* | Balanced accuracy** | |
| Single amino acid substitutions | 20821 | 36825 | 57646 | 78.39 | 79.11 | 78.85 | 78.75 |
| Deletions | 652 | 77 | 729 | 95.86 | 67.53 | 92.87 | 81.70 |
| Insertions | 110 | 61 | 171 | 92.73 | 80.33 | 88.30 | 86.53 |
| Replacements | 79 | 59 | 138 | 92.41 | 61.02 | 78.99 | 76.71 |
| Total | 21662 | 37022 | 58684 | 79.04 | 79.06 | 79.05 | 79.05 |
Table 2. Number of non-human protein variations and prediction accuracy of PROVEAN.
| Variant types | Functional outcome | Performance (%) | |||||
|---|---|---|---|---|---|---|---|
| Deleterious | Neutral | Total | Sensitivity | Specificity | Accuracy* | Balanced accuracy** | |
| Single amino acid substitutions | 14117 | 16498 | 30615 | 80.22 | 75.33 | 77.55 | 77.75 |
| Deletions | 142 | 227 | 369 | 83.10 | 60.35 | 69.11 | 71.73 |
| Insertions | 34 | 137 | 171 | 76.47 | 73.72 | 74.27 | 75.10 |
| Replacements | 886 | 1029 | 1915 | 86.46 | 62.88 | 73.79 | 74.67 |
| Total | 15179 | 17891 | 33070 | 80.60 | 74.36 | 77.22 | 77.48 |
Note:
- *Accuracy=(TP + TN)/(TP + TN + FP + FN); affected by potential unequal sizes of deleterious and neutral datasets
- **Balanced Acurracy=(Sn + Sp)/2; unaffected by potential unequal sizes of deleterious and neutral datasets
3. Comparison with Other Tools for Single Amino Acid Substitutions
(a) Prediction accuracy of different tools
The performance of PROVEAN was compared with other prediction tools: Mutation Assessor, SIFT, PolyPhen-2, and Condel, using default score thresholds suggested by individual tools. Overall, the performance of PROVEAN is comparable to other tools as shown in Tables 3 and 4.
Table 3. Prediction accuracy of PROVEAN, Mutation Assessor, SIFT, PolyPhen-2, and Condel for the Uniprot human protein variant datasets.
| Prediction tools | Score thresholds | Human dataset | References | ||||
|---|---|---|---|---|---|---|---|
| Sensitivity | Specificity | Accuracy* | Balanced accuracy** | No prediction | |||
| PROVEAN | -2.282 -1.500 |
78.39 86.65 |
79.11 68.84 |
78.85 75.27 |
78.75 77.74 |
0 | Choi et al., 2012; web |
| Mutation Assessor | 0.800 1.90 |
96.54 85.29 |
40.59 71.02 |
60.90 76.20 |
68.57 78.15 |
317 (0.55%) |
Reva et al., 2011; web |
| SIFT | 0.050 | 85.03 | 68.95 | 74.77 | 76.99 | 1147 (1.99%) |
Kumar et al., 2009; web |
| PolyPhen-2 | 0.432 | 88.68 | 62.45 | 72.00 | 75.56 | 2279 (3.95%) |
Adzhubei et al., 2010; web |
| Condel web server | 0.469 | 93.84 | 46.23 | 64.67 | 70.04 | 7194 (12.48%) |
González-Pérez and López-Bigas, 2011; web |
Table 4. Prediction accuracy of PROVEAN, Mutation Assessor, SIFT, and PolyPhen-2 for the Uniprot non-human protein variant datasets.
| Prediction tools | Score thresholds | Non-human dataset | ||||
|---|---|---|---|---|---|---|
| Sensitivity | Specificity | Accuracy* | Balanced accuracy** | No prediction | ||
| PROVEAN | -2.282 -1.500 |
80.22 86.17 |
75.27 66.80 |
77.55 75.73 |
77.75 76.48 |
0 |
| Mutation Assessor | 0.800 1.90 |
93.17 81.30 |
45.13 67.16 |
67.07 73.62 |
69.15 74.23 |
732 (2.39%) |
| SIFT | 0.050 | 87.47 | 69.27 | 77.88 | 78.37 | 1542 (5.04%) |
| PolyPhen-2 | 0.432 | 87.77 | 65.81 | 76.11 | 76.79 | 1499 (4.90%) |
Note:
- The Uniprot human and non-human protein variant datasets were used.
- The comparison was performed only for single amino acid substitutions because other tools do not handle other types of variation such as amino acid insertion or deletion.
- The "No prediction" column shows the number of variants for which the corresponding tool fails to provide a prediction.
- PROVEAN v1.0, Mutation Assessor web server v1.0, SIFT v4.0.3, PolyPhen-2 webserver v2.1.0, and Condel web server v1.4 were used.
- *Accuracy=(TP + TN)/(TP + TN + FP + FN); affected by potential unequal sizes of deleterious and neutral datasets
- **Balanced Acurracy=(Sn + Sp)/2; unaffected by potential unequal sizes of deleterious and neutral datasets
(b) Prediction consistency among different tools
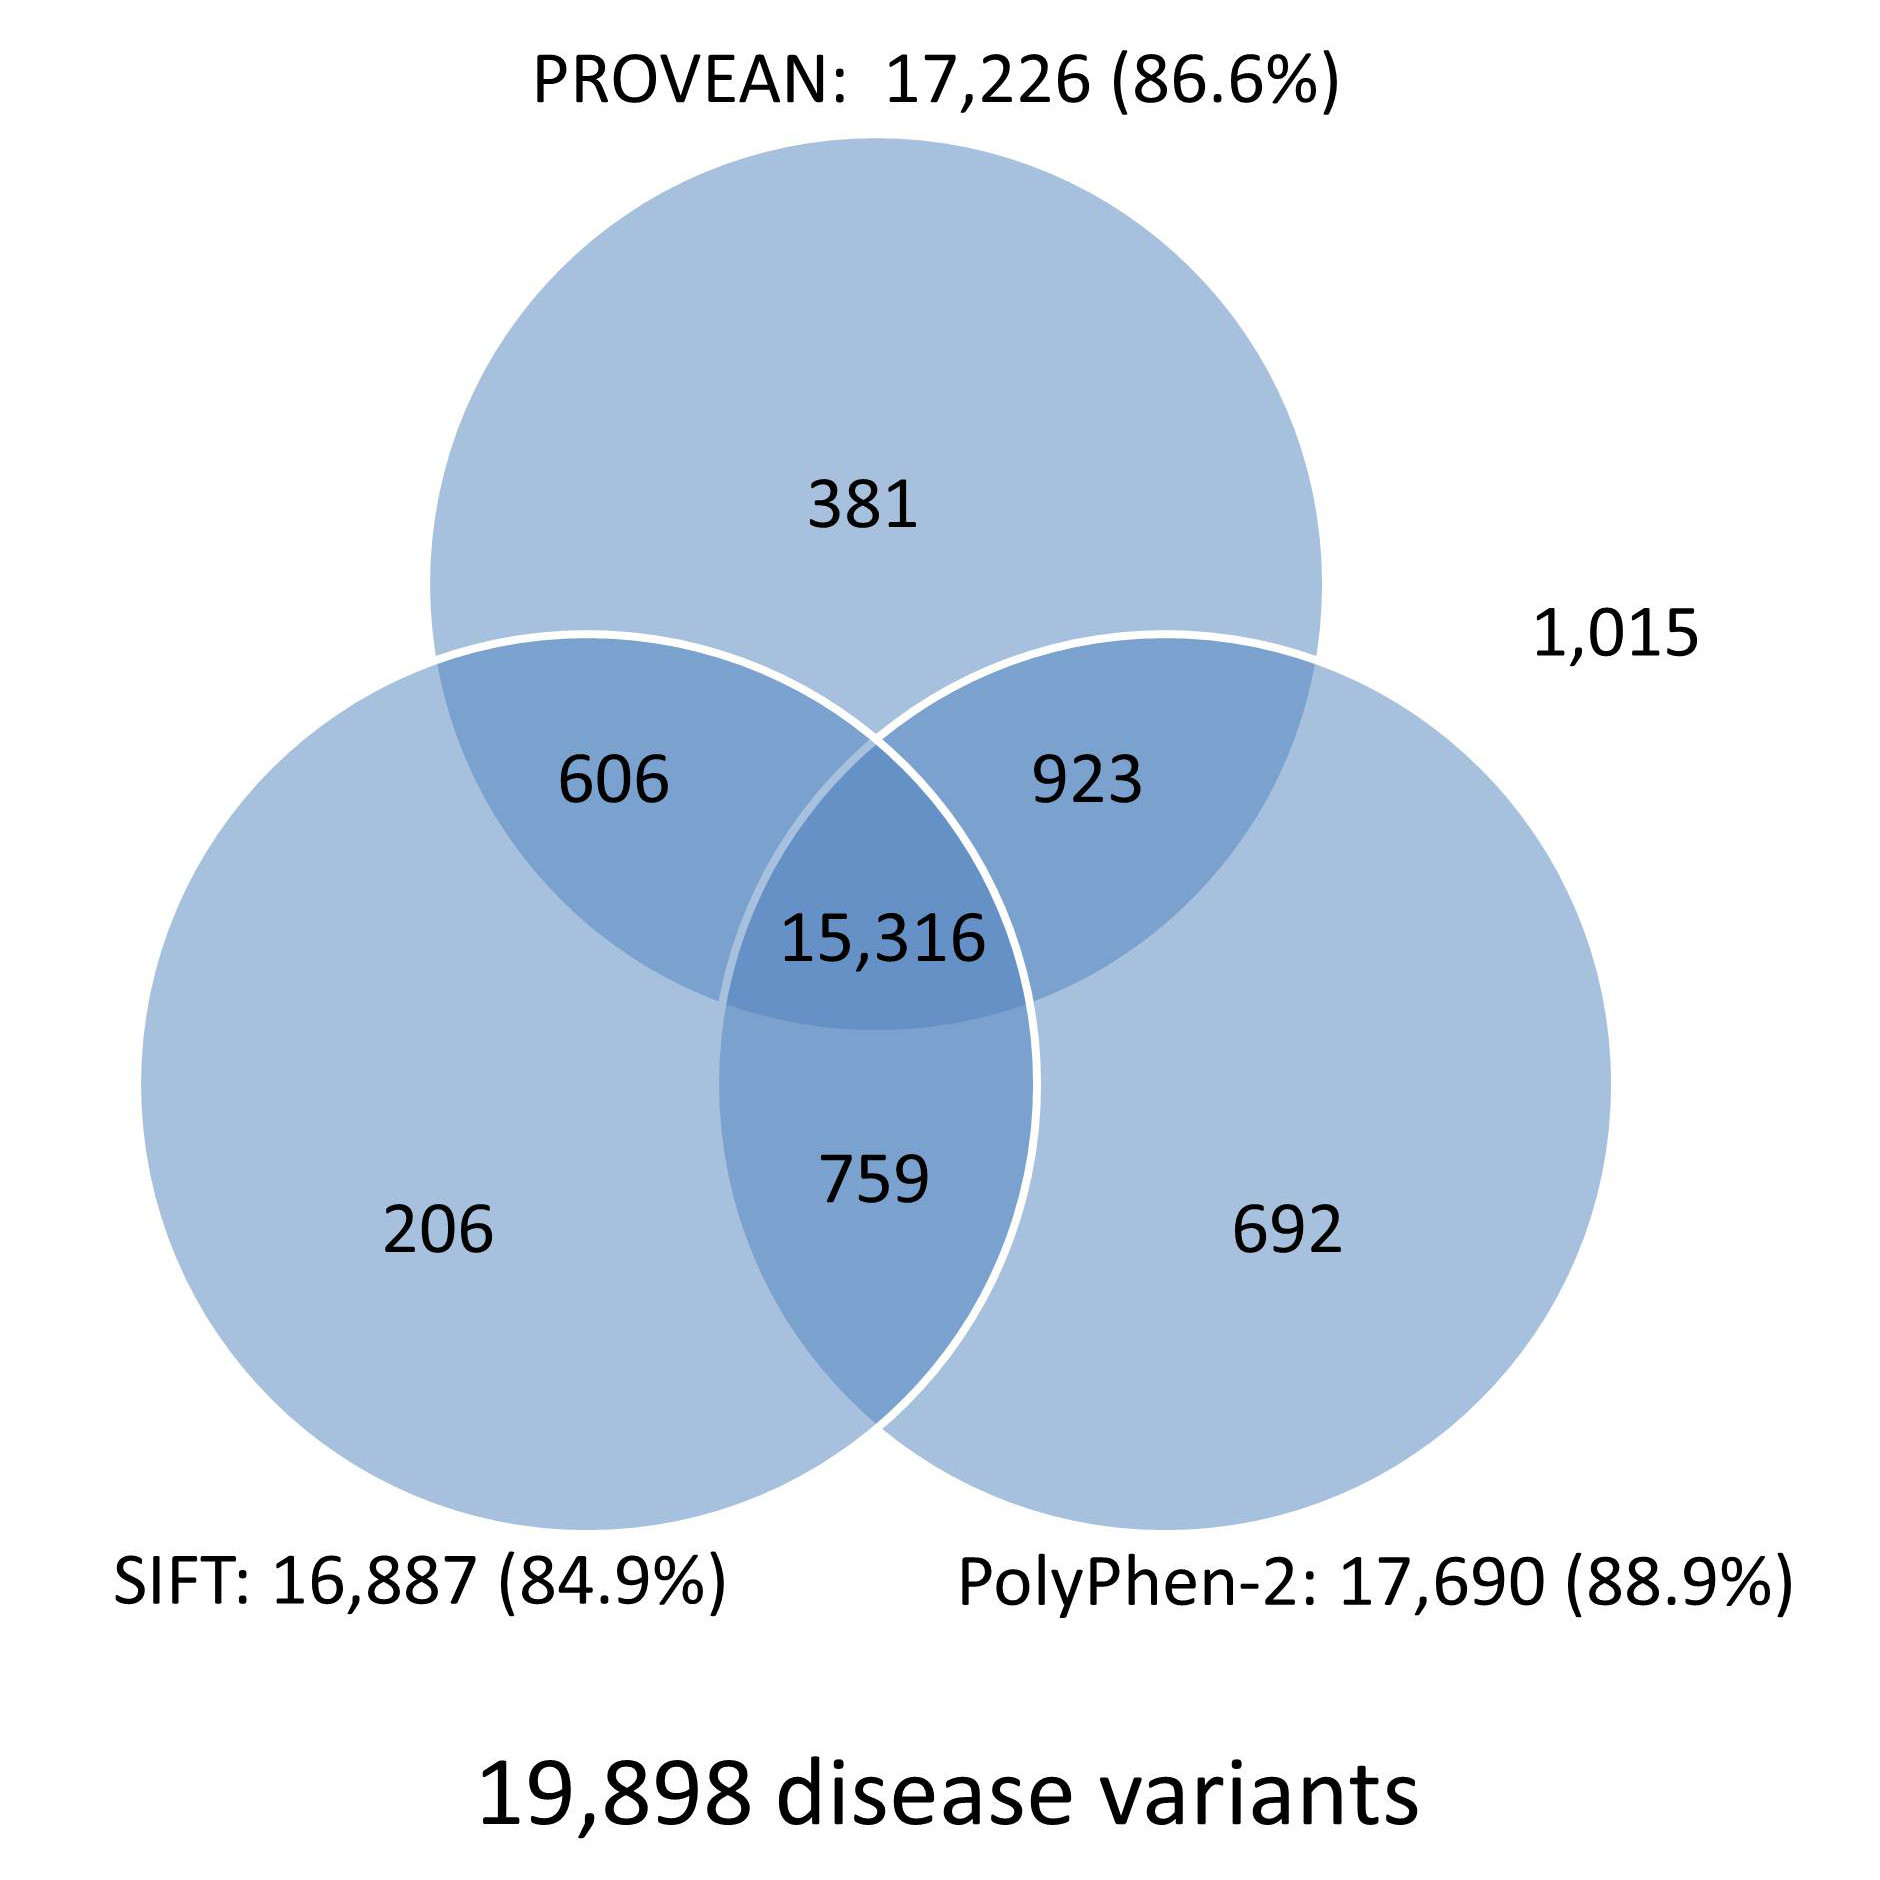
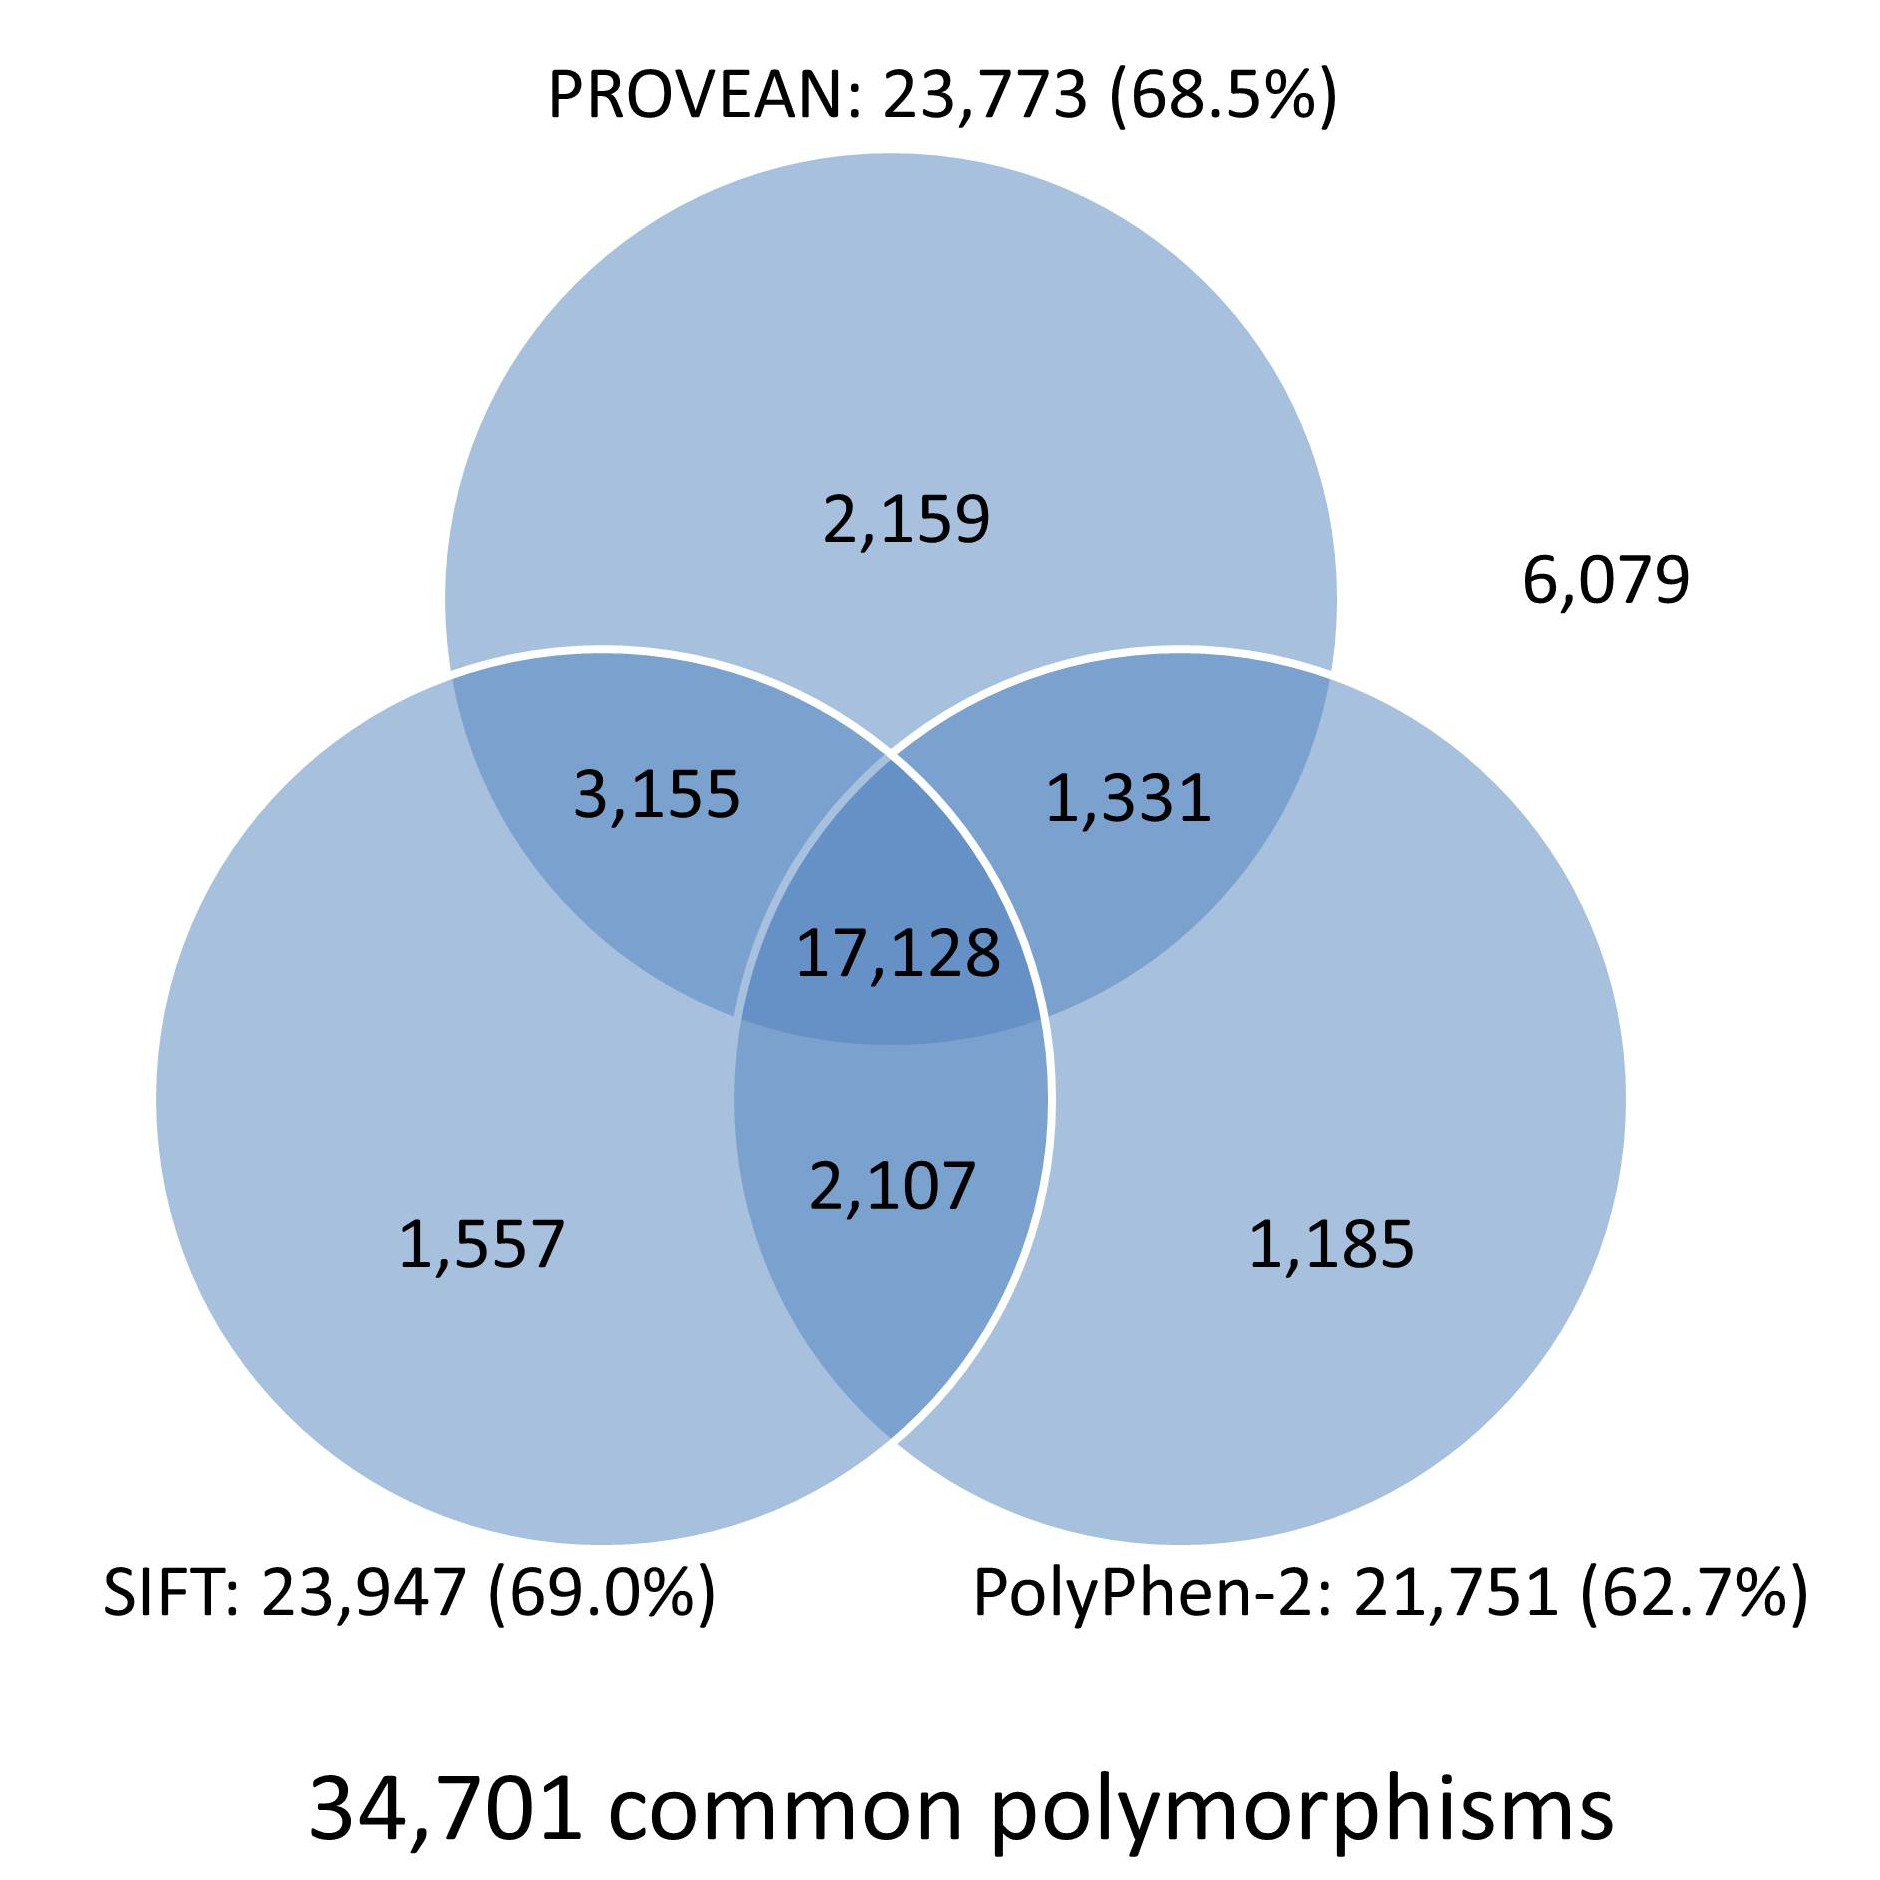
The prediction results for the Uniprot human protein variant dataset were obtained from multiple tools including PROVEAN, SIFT, and PolyPhen-2, and are summarized in a Venn diagram shown in Figure 3. Overall, the prediciton results for 77% (15,316/19,898) of disease-associated variants and 49% (17,128/34,701) common variants are in agreement and shared by all three tools. In addition, each tool produces correct predictions for distinct subsets of disease or neutral variants. Combining prediction results from multiple tools can increase the chance of identifying functional variants that had been missed by other tools.
Figure 3. A Venn diagram showing predictions from PROVEAN, SIFT, and PolyPhen-2 for the human protein variant dataset (score thresholds used: PROVEAN, -1.5; SIFT, 0.05; PolyPhen-2, 0.432).
Note:
The number and percentage of correctly predicted variants are shown next to each tool.